
2026 Maruti Brezza Price List, Features, Mileage &
Jul 27, 2026


4 Types of Data – Nominal, Ordinal, Discrete, Continuous
Introduction to Data Types in Statistics
In statistics and data analysis, understanding types of data is essential for accurate interpretation and decision-making. Data is broadly classified into 4 Types of Data: nominal, ordinal, discrete, and continuous. These data types help analysts organize information, choose the right statistical methods, and create meaningful visualizations.
Whether you are a beginner in data science, statistics, or analytics, knowing these classifications improves your ability to work with real-world datasets. In this guide, we will explore the 4 types of data in statistics, their definitions, examples, and key differences in a simple and easy-to-understand way.
What is Data? A Simple Explanation
Data refers to raw facts, figures, or information collected for analysis. It can be numbers, text, measurements, or observations. For example, a person’s age, name, or height are all forms of data. Data can be structured (organized in tables) or unstructured (like images or text). In simple terms, data helps us understand patterns, make predictions, and support decisions. Without data, modern technologies like machine learning, artificial intelligence, and business intelligence would not exist.
Why Understanding Data Types is Important in Data Analysis
Knowing the type of data you are working with is crucial for selecting the correct analysis method. For instance, numerical data can be used for calculations, while categorical data is used for grouping. Misclassifying data can lead to incorrect results and poor decisions. Data types also determine which charts to use—like bar charts for categorical data or histograms for numerical data. In fields like data science and research, proper classification improves accuracy, efficiency, and insights, making it a fundamental skill.
Overview of the Four Types of Data
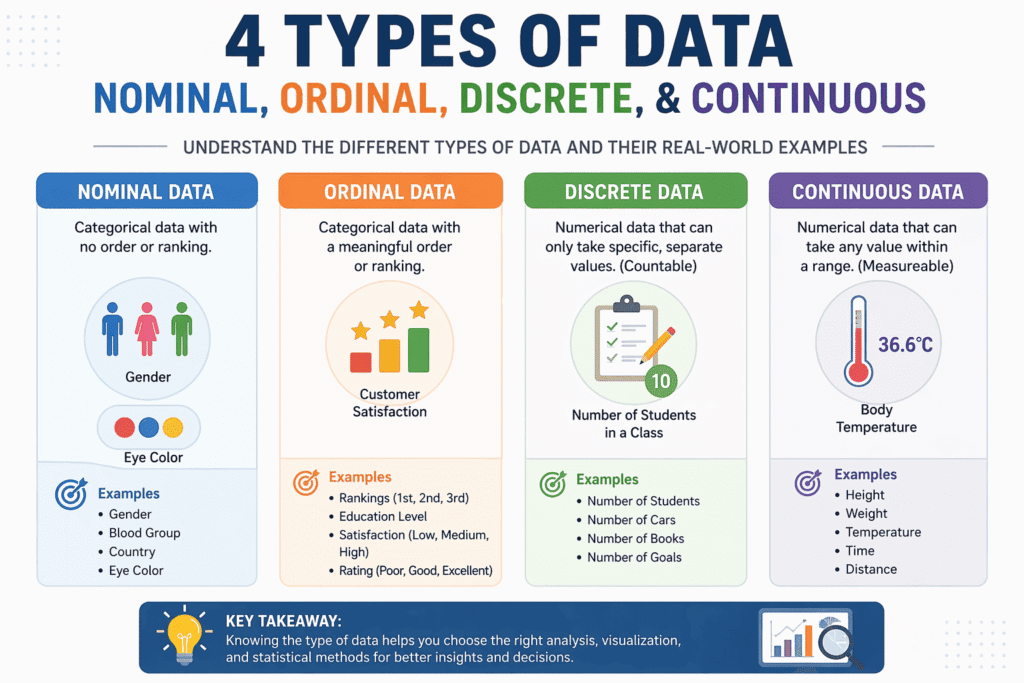
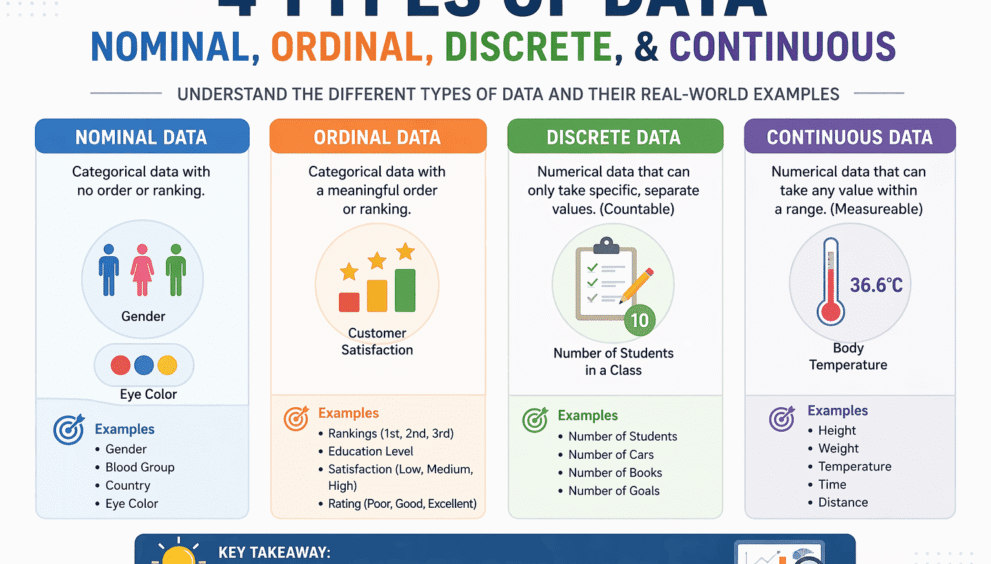
Data is broadly classified into four main types: nominal, ordinal, discrete, and continuous. Nominal and ordinal data are categorical, meaning they describe qualities or categories. Discrete and continuous data are numerical, representing quantities. Nominal data has no order, while ordinal data has a meaningful ranking. Discrete data includes countable values, whereas continuous data includes measurable values that can take any range. Understanding these differences helps in organizing, analyzing, and interpreting data effectively across various domains.
1. Nominal Data
What is Nominal Data? Definition and Meaning
Nominal data is a type of categorical data that represents labels or names without any order or ranking. It is used to classify information into distinct categories. For example, gender, blood group, and nationality are nominal data types. These categories cannot be arranged in a meaningful sequence. Nominal data is often used in surveys and classification tasks. It is the simplest form of data and serves as a foundation for more complex data types.
Characteristics of Nominal Data
Nominal data has unique features that distinguish it from other data types. It consists of categories with no inherent order or hierarchy. Each value is mutually exclusive, meaning it belongs to only one category. Mathematical operations like addition or averaging cannot be applied. Nominal data is often represented using labels or names rather than numbers. It is commonly visualized using bar charts or pie charts. This type of data is widely used in classification and grouping tasks in statistics and data analysis.
Examples of Nominal Data in Real Life
Nominal data is commonly found in everyday situations. Examples include gender (male, female), eye color (blue, brown, green), types of cuisine (Indian, Chinese, Italian), and car brands (Toyota, BMW, Tesla). In surveys, responses like “yes” or “no” are also nominal. These examples highlight how nominal data is used to categorize information without implying any order. It is especially useful in market research, customer segmentation, and basic data classification tasks.
Nominal Data vs Other Data Types
Nominal data differs significantly from other data types. Unlike ordinal data, it does not have any ranking or order. Compared to discrete and continuous data, it is non-numerical and cannot be measured or counted in a mathematical sense. While discrete and continuous data involve quantities, nominal data focuses on categories. Understanding these differences helps analysts avoid mistakes, such as trying to calculate averages for nominal data, which is not meaningful.
2. Ordinal Data
What is Ordinal Data? Definition and Meaning
Ordinal data is a type of categorical data that includes a clear order or ranking among values. However, the differences between the ranks are not necessarily equal. For example, ratings like “poor,” “average,” and “excellent” represent ordinal data. While you can determine which value is higher or lower, you cannot measure the exact difference between them. Ordinal data is commonly used in surveys, feedback forms, and ranking systems, making it highly useful in qualitative analysis.
Key Features of Ordinal Data
Ordinal data has several defining characteristics. It maintains a logical order or ranking among categories. However, the intervals between values are not uniform or measurable. Like nominal data, it is categorical, but with an added sense of hierarchy. Mathematical operations are limited, though comparisons like greater than or less than are possible. Ordinal data is often visualized using bar charts or ordered lists. It is widely used in customer satisfaction surveys and performance evaluations.
Examples of Ordinal Data in Statistics
Common examples of ordinal data include educational levels (high school, bachelor’s, master’s), customer satisfaction ratings (low, medium, high), and class rankings (first, second, third). Another example is Likert scale responses such as “strongly agree” to “strongly disagree.” These examples show how ordinal data provides meaningful order but does not define exact differences between categories. It plays a crucial role in social sciences, research studies, and business analytics.
Difference Between Nominal and Ordinal Data
The key difference between nominal and ordinal data lies in order. Nominal data has no ranking, while ordinal data follows a specific sequence. For example, colors (red, blue, green) are nominal, but rankings (1st, 2nd, 3rd) are ordinal. Nominal data only categorizes, whereas ordinal data adds meaning through order. However, both are categorical and do not support advanced mathematical operations. Understanding this distinction is essential for accurate data classification and analysis.
3. Discrete Data
What is Discrete Data? Definition and Explanation
Discrete data is a type of numerical data that consists of countable values. These values are usually whole numbers and cannot be divided into smaller parts. For example, the number of students in a class or the number of cars in a parking lot represents discrete data. It is obtained through counting rather than measuring. Discrete data has gaps between values, meaning it cannot take every possible number. It is commonly used in statistics, mathematics, and data analysis for counting-based observations.
Properties of Discrete Data
Discrete data consists of countable, distinct values, usually whole numbers. It cannot take fractional or decimal values in most cases. There are clear gaps between possible values, meaning it jumps from one number to another (e.g., 1, 2, 3). Discrete data is finite or countably infinite and is often collected through counting processes. It is easy to analyze and visualize using bar charts or frequency tables. This type of data is commonly used in probability, statistics, and real-world counting scenarios.
Examples of Discrete Data in Daily Life
Discrete data appears frequently in everyday life. Examples include the number of students in a classroom, the number of books on a shelf, or the number of goals scored in a match. Other examples include counting customers visiting a store or the number of emails received in a day. These values are countable and cannot be broken into smaller meaningful units. Discrete data is essential in business analytics, inventory management, and performance tracking.
Discrete Data vs Continuous Data
The main difference between discrete and continuous data is how values are represented. Discrete data is countable and consists of separate values, while continuous data is measurable and can take any value within a range. For example, the number of students is discrete, but their height is continuous. Discrete data has gaps, whereas continuous data is smooth and uninterrupted. Understanding this distinction is crucial for selecting the right statistical methods and data visualization techniques.
4. Continuous Data
What is Continuous Data? Definition and Explanation
Continuous data is a type of numerical data that can take any value within a given range. Unlike discrete data, it is measured rather than counted. Examples include height, weight, temperature, and time. Continuous data can include decimal and fractional values, making it more precise. It is widely used in scientific research, engineering, and data analysis. Because it can take infinite possible values within a range, continuous data provides detailed insights into measurements and trends.
Characteristics of Continuous Data
Continuous data has several important characteristics. It can take an infinite number of values within a specific range. It is measured using instruments like rulers, thermometers, or scales. Unlike discrete data, there are no gaps between values. Continuous data supports mathematical operations such as addition, subtraction, and averaging. It is often represented using line graphs, histograms, or scatter plots. This type of data is essential for accurate measurement and analysis in various fields.
Examples of Continuous Data in Real World
Continuous data is widely used in real-world applications. Examples include measuring a person’s height, weight, temperature, or speed. Time taken to complete a task and distance traveled are also continuous data examples. In healthcare, blood pressure and heart rate are measured as continuous variables. These examples highlight how continuous data provides precise and detailed information, making it crucial for scientific studies, engineering, and data-driven decision-making.
Continuous vs Discrete Data: Key Differences
Continuous and discrete data differ mainly in how values are obtained. Continuous data is measured and can take any value within a range, while discrete data is counted and consists of specific values. Continuous data includes decimals, whereas discrete data typically involves whole numbers. For example, weight is continuous, but the number of items is discrete. Continuous data is more detailed, while discrete data is simpler to analyze. Choosing the correct type is essential for accurate analysis.
Comparison Table of Nominal, Ordinal, Discrete, and Continuous Data
| Data Type | Nature | Order | Numeric | Example |
| Nominal | Categorical | No | No | Gender, Color |
| Ordinal | Categorical | Yes | No | Rankings, Ratings |
| Discrete | Numerical | Yes | Yes | Number of Students |
| Continuous | Numerical | Yes | Yes | Height, Temperature |
This comparison helps quickly identify differences and choose the right data type for analysis.
How to Identify Different Types of Data Easily
To identify data types, start by asking simple questions. Is the data categorical or numerical? If categorical, check whether it has an order—if yes, it’s ordinal; if not, nominal. If numerical, determine whether it is countable (discrete) or measurable (continuous). This step-by-step approach simplifies classification. Practice with real-world examples to improve accuracy. Correct identification is essential for choosing appropriate statistical techniques and ensuring meaningful results.
Applications of Data Types in Data Science and Analytics
Different data types play a crucial role in data science and analytics. Nominal data is used in classification tasks, while ordinal data helps in ranking and prioritization. Discrete data is useful for counting and probability calculations, whereas continuous data is essential for measurements and predictive modeling. Understanding these types allows data scientists to clean, process, and analyze data effectively. It also helps in selecting machine learning models and visualization techniques.
Common Mistakes When Classifying Data Types
One common mistake is confusing nominal and ordinal data, especially when categories appear ordered. Another error is treating discrete data as continuous, which can lead to incorrect analysis. Some people also attempt mathematical operations on categorical data, which is not meaningful. Misclassification can result in wrong conclusions and flawed insights. To avoid these mistakes, always analyze the nature of data carefully and apply proper classification techniques.
Also read: What is Data Science in Simple Words
Conclusion:
Understanding the four types of data—nominal, ordinal, discrete, and continuous—is essential for accurate data analysis. Each type serves a specific purpose and requires different methods of handling. Choosing the correct data type improves decision-making, enhances analysis accuracy, and ensures better results. Whether you are a student, researcher, or data professional, mastering these concepts will strengthen your analytical skills and help you work with data more effectively.
Frequently Asked Questions (FAQs)
1. What are the 4 types of data in statistics?
The four main types of data in statistics are nominal, ordinal, discrete, and continuous. Nominal and ordinal are categorical data types, while discrete and continuous are numerical. Each type is used differently in data analysis depending on whether the data represents categories, rankings, counts, or measurements.
2. What is the difference between nominal and ordinal data?
Nominal data represents categories without any order, such as colors or gender. Ordinal data, on the other hand, includes a meaningful order or ranking, like satisfaction levels (low, medium, high). However, ordinal data does not show the exact difference between ranks.
3. What is discrete and continuous data with examples?
Discrete data consists of countable values, such as the number of students in a class. Continuous data includes measurable values that can take any value within a range, such as height, weight, or temperature. Discrete data has gaps, while continuous data is smooth and uninterrupted.
4. How do you identify different types of data?
To identify data types, first check if the data is categorical or numerical. If categorical, determine if it has an order (ordinal) or not (nominal). If numerical, check whether it is countable (discrete) or measurable (continuous). This method helps in accurate classification.
5. Why are data types important in data analysis?
Data types are important because they determine how data is analyzed and visualized. Choosing the wrong data type can lead to incorrect results. Proper classification helps in selecting the right statistical methods, improving accuracy and decision-making.
6. Is age discrete or continuous data?
Age is generally considered continuous data because it can be measured precisely (e.g., 25.5 years). However, when rounded to whole numbers, it may sometimes be treated as discrete for simplicity in analysis.
7. Can nominal data be numerical?
Nominal data can be represented using numbers (like 1 for male, 2 for female), but these numbers are just labels and have no mathematical meaning. You cannot perform calculations like addition or averaging on nominal data.
8. What are real-life examples of ordinal data?
Examples of ordinal data include rankings (1st, 2nd, 3rd), customer satisfaction levels (poor, good, excellent), and education levels (high school, bachelor’s, master’s). These data types have order but no fixed interval between values.
9. What type of data is temperature?
Temperature is continuous data because it can take any value within a range and includes decimal points. It is measured rather than counted, making it suitable for detailed analysis.
10. What is the easiest way to remember data types?
A simple way to remember is:
Nominal = Names (no order)
Ordinal = Order (ranked)
Discrete = Count (whole numbers)
Continuous = Measure (any value)
This shortcut helps quickly identify data types during analysis.


How Many Types of CSS? Learn All CSS Types With Examples
02nd Jun 2026[…] 4 Types of Data – Nominal, Ordinal, Discrete, […]